

Governance, Process Discipline & Integrated Technology as the Foundation for Revenue Protection
Executive Summary
Revenue leakage is the single most controllable threat to profitability for mid-size independent hotels in India and the Middle East. Unlike macroeconomic shocks or new competition, revenue leaks are entirely preventable, yet they drain 8-15% of potential top-line revenue year after year because hotels lack the three foundational elements that stop them: good governance, disciplined processes, and an integrated technology stack that delivers clean data and actionable insights.
This report focuses specifically on the India and Middle East markets, where the leakage profile differs from Western markets in critical ways. In India, the Goods and Services Tax (GST) regime creates a unique leakage vector, with rates jumping from 5% to 18% when room tariffs cross the Rs 7,500 threshold, creating pricing distortions that independent hotels frequently mismanage. In the Middle East, the explosion of new supply, Saudi Arabia’s Vision 2030 giga-projects, and the wholesale rate leakage from B2B channels into consumer-facing platforms create a leakage environment that did not exist at this scale five years ago.
The central argument of this report is that technology alone cannot stop revenue leakage, and neither can good intentions. Revenue protection requires a virtuous cycle: governance sets the rules, process discipline enforces them, integrated technology captures and flows data cleanly, and that clean data feeds better decisions that tighten governance further. Hotels that build all three pillars recover 60-80% of their leakage within 12 months. Hotels that invest in technology without governance, or enforce SOPs without clean data to measure compliance, see minimal sustained improvement.
| Key Statistics: India & Middle East |
| • India OTA commissions: 18-25% (MakeMyTrip/Goibibo highest at 22-25%) • India premium hotel occupancy: 72-74% (ICRA FY2026 forecast) • India revenue growth normalizing to 6-8% YoY after three years of double-digit gains • Middle East hotel pipeline: 600,000+ rooms under development • Saudi Arabia hospitality market: $53.22B (2025), projected $116.73B by 2034 • 42% of small hotels cite system integration as the top barrier to RMS adoption • Middle East booking window shrinking: 40-50% of bookings within 0-7 days • 84% of Indian hoteliers report significant operational improvement after cloud PMS adoption |
The India & Middle East Landscape
India: High Growth, High OTA Dependence
The Indian hospitality sector has experienced extraordinary growth over the past three years, with premium hotels achieving occupancy rates of 70-72% and average room rates exceeding Rs 6,000 per night. Hotel revenues saw a robust 20% increase over 2022, and operating margins surpassed the 30% mark. However, ICRA has revised the industry outlook to Stable from Positive, expecting normalized revenue growth of 6-8% in FY2026 on a high base, after three years of double-digit expansion. Pan-India premium hotel occupancy is projected to hold at 72-74%, with average room rates rising to Rs 8,200-8,500.
This maturing market creates a paradox for independent hotels. Growth is slowing, competition is intensifying, yet OTA dependence remains structurally high. The India Online Accommodation Market analysis from Mordor Intelligence identifies high OTA commission structure as a key restraint with a -1.8% impact on CAGR forecast, with commission rates climbing from 15-18% toward 40-45% before hotel association pressure forced MakeMyTrip to cap commissions near 22%. For a typical 10-room Indian property at 60% occupancy with Rs 2,500 ADR, an 80:20 OTA-to-direct booking ratio means losing Rs 8,76,000 annually to commissions alone. Shifting that ratio to 40:60 saves Rs 4,38,000 per year.
The GST regime adds another India-specific layer of complexity. Room tariffs below Rs 1,000 attract 0% GST, Rs 1,001-7,500 attract 12%, and above Rs 7,500 attract 18%. This step-function creates a powerful disincentive to price just above a threshold, yet many independent hotels fail to optimize around these breakpoints. GST filing workloads, varying tax slabs for rooms versus F&B versus ancillary services, and delayed input-tax credit refunds constrain working capital, particularly for properties without dedicated accountants. Mordor Intelligence rates this complex multi-layer GST burden as a -1.2% drag on market CAGR.
Middle East: The Supply Boom Challenge
The Middle East presents a fundamentally different leakage profile. The region’s hospitality sector is valued at over $250 billion in total assets, with 600,000 rooms currently under development and Saudi Arabia commanding 60% of the GCC construction pipeline. The Saudi Arabian hospitality market alone was valued at $53.22 billion in 2025 and is projected to reach $116.73 billion by 2034 at a 9.12% CAGR. This unprecedented supply growth, while creating enormous opportunity, also intensifies competition and compresses pricing power for independent and mid-scale properties.
From a revenue management perspective, the Middle East faces distinct challenges that amplify leakage. Duetto’s on-the-ground analysis reveals that the booking window is shrinking dramatically, with 40-50% of bookings now happening within 0-7 days of arrival. This compression makes demand forecasting far more difficult and increases the penalty for hotels that lack real-time pricing capability. Geopolitical instability creates demand volatility that static pricing cannot capture. Cultural diversity across guest segments requires tailored pricing strategies that many independent properties lack the tools to execute.
Perhaps most critically for leakage, Duetto reports that data discipline in the region is often lacking. Revenue leaders admitted that their analytics processes are not as advanced as needed for where the market currently stands. Systems can only work when fed with the right inputs. Budget constraints, driven by a lack of understanding from ownership about the value of revenue management technology, compound the problem. Hotels in the Middle East are building world-class physical products but frequently underinvesting in the commercial infrastructure needed to monetize them effectively.
The Three Pillars of Revenue Protection
Stopping revenue leakage is not a technology project, a training initiative, or a policy update. It is a systemic transformation that requires three mutually reinforcing pillars. Each pillar feeds the next, and weakness in any one undermines the entire structure. This framework is especially relevant for India and the Middle East, where rapid market growth has often outpaced the development of governance structures and technology infrastructure.
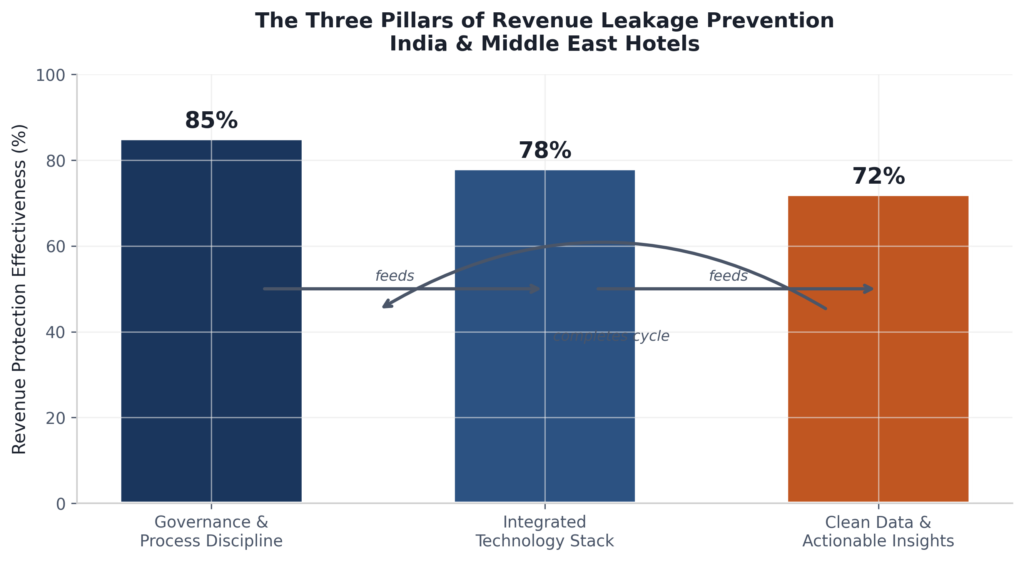
Figure 1: The Three Pillars of Revenue Leakage Prevention
Pillar I: Governance & Process Discipline
Governance is the foundation. Without clear ownership, documented standard operating procedures (SOPs), and accountability metrics, no technology investment will deliver sustained results. For independent hotels in India and the Middle East, governance often breaks down at the ownership level, where family-owned businesses may lack formal commercial structures, or where ownership groups view revenue management as an operational cost rather than a profit center.
Effective hotel governance for revenue protection includes several non-negotiable elements. First, a designated revenue owner must be identified, whether a revenue manager, general manager, or owner-operator, with clear KPI accountability. Second, SOPs must be documented and enforced across every revenue touchpoint: rate overrides require management approval with documented justification; no-show and cancellation charges follow a written policy with no exceptions without documented waivers; comp stays and staff discounts require pre-authorization; and F&B postings, minibar charges, and ancillary services follow a closed-loop verification process. The hotel night audit serves as the daily financial checkpoint that validates compliance. As DocMX notes, a disciplined night audit reconciliation process reduces revenue leakage, supports clean revenue reporting, and strengthens internal controls. Properties that standardize night audit procedures across shifts see dramatically fewer errors carried forward.
Third, financial reporting must align with industry standards. Hotels cannot benchmark performance effectively if their reporting does not follow USALI (Uniform System of Accounts for the Lodging Industry) standards. Without standardized reporting, comparing property performance, identifying variances, and spotting leakage patterns becomes nearly impossible. Fourth, approval thresholds and exception tracking must be enforced. Every adjustment, void, rate override, and waived fee should be logged with the authorizer’s name, reason code, and financial impact. This data becomes invaluable when auditing for patterns of leakage.
Pillar II: Integrated Technology Stack
Technology is the enabler, but only when systems are integrated and data flows cleanly between them. The hotel technology landscape in India and the Middle East is evolving rapidly, yet fragmentation remains the norm. A typical mid-size independent hotel may operate a Property Management System (PMS) from one vendor, a channel manager from another, a Point-of-Sale (POS) system for F&B that does not connect to the PMS, and spreadsheets for revenue management. Each disconnected system creates data silos, manual reconciliation points, and opportunities for error.
The global PMS market data reveals the scale of this challenge. While North America and Europe achieve 80-85% PMS adoption with high integration rates, Middle East and Africa collectively represent only 6% of global PMS market share, with approximately 150,000 PMS properties and cloud adoption at 60%. Asia-Pacific has stronger penetration with 300,000 PMS properties, including 35,000 in India, but integration maturity varies widely. The acquisition of Atomize (RMS) by Mews (PMS) in 2024 underscores the industry’s recognition that the future lies in fully integrated platforms where pricing, inventory, and guest data flow seamlessly.
For India and Middle East hotels, the priority integration map is clear. The highest-impact connections are, in order: PMS-to-channel manager (prevents overbookings and ensures rate parity), PMS-to-POS (eliminates unbilled F&B and ancillary charges), PMS-to-RMS (enables dynamic pricing based on real demand signals), and PMS-to-payment gateway (reduces billing errors and accelerates cash collection). A practical roadmap for integration starts with auditing current systems, prioritizing the highest-impact connections, choosing integration-friendly partners with open APIs, planning a 4-8 week transition for basic integrations, and measuring results before expanding.
Cloud migration is a critical enabler. Cloud PMS adoption grew 55% in mid-scale hotels between 2023 and 2025, and 84% of Indian hoteliers report significant operational improvement after adopting cloud-based solutions. Cloud platforms offer real-time synchronization, automatic updates, remote accessibility, and lower total cost of ownership, all of which support the governance and data-quality objectives that revenue protection requires.
Pillar III: Clean Data & Actionable Insights
Clean data is the output of good governance and integrated technology, and the input for better decision-making. Without it, hotels are flying blind. The Middle East revenue management community has acknowledged this gap explicitly: analytics processes are not as advanced as market conditions demand. In India, the challenge is compounded by GST complexity, multi-language operations, and the sheer fragmentation of the independent hotel segment.
Data governance in hospitality encompasses several dimensions. Data quality means ensuring that reservation records, rate codes, guest folios, and financial entries are accurate, complete, and consistent. Data integration means eliminating silos so that revenue, operations, and finance teams work from the same source of truth. Data accessibility means dashboards and reports that deliver the right information to the right person at the right time. And data actionability means converting insights into decisions, such as rate changes, channel mix adjustments, or process improvements.
The five types of analytics provide a maturity framework. Descriptive analytics (what happened) is the baseline, reporting on occupancy, ADR, RevPAR, and channel mix. Diagnostic analytics (why it happened) digs into variance analysis, identifying why a particular channel underperformed or why a rate strategy failed. Predictive analytics (what will happen) uses demand forecasting and competitor rate monitoring to anticipate market shifts. Prescriptive analytics (what should we do) provides algorithmic recommendations for pricing and inventory decisions. And cognitive analytics (how do we automate) leverages AI to continuously optimize without human intervention. Most independent hotels in India and the Middle East remain at the descriptive level. Moving up the maturity curve requires both technology investment and the governance discipline to act on what the data reveals.
Major Sources of Revenue Leakage
Revenue leakage in India and the Middle East clusters around seven primary sources. The following breakdown reflects the specific market dynamics of these regions, including GST complexity in India and B2B rate leakage in the Middle East.
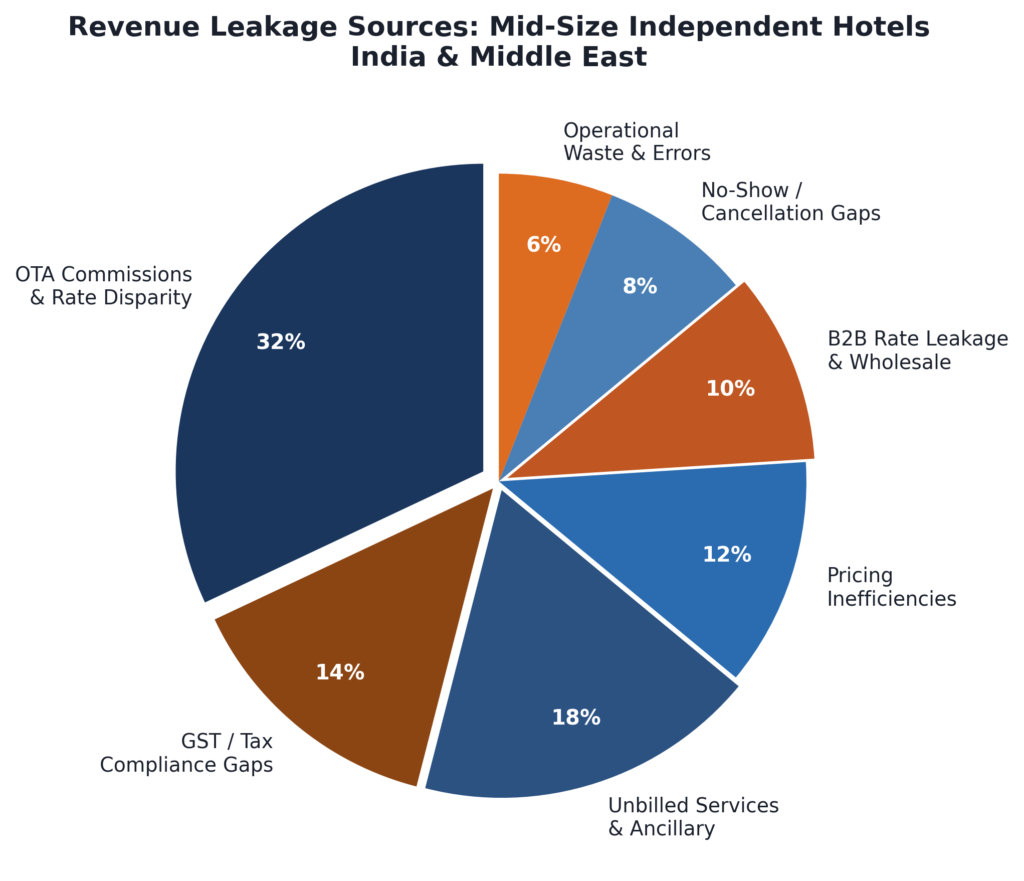
Figure 2: Distribution of Revenue Leakage Sources — India & Middle East
OTA Commissions and Rate Disparity (32%)
OTA commissions remain the single largest leakage source across both markets. In India, the commission landscape is particularly challenging for independents. MakeMyTrip and Goibibo charge 18-25%, with higher rates for preferred listing and top placement. OYO takes 20-25% and has been criticized for deep discounting that sets prices below the hotel’s preferred rate, eroding brand identity. Booking.com and Agoda charge 15-22%, while Expedia ranges from 15-25%. The effective cost is even higher when visibility boosters, loyalty program discounts, and payment delays are factored in. Agoda’s payment cycle of 30-45 days is especially burdensome for Indian properties with tight working capital.
In the Middle East, the commission structure is similar, but the leakage is amplified by rate disparity and the wholesale-to-retail leak. Triptease research shows OTAs undercut direct hotel prices an average of 25% of the time, costing the industry over $1 billion annually in direct bookings. When a potential guest finds a lower rate on Booking.com than on the hotel’s own website, the booking shifts to the OTA, increasing commission costs and denying the hotel the guest relationship. For Middle East properties with high fixed costs and thin margins during off-peak seasons, this shift can be the difference between profit and loss.
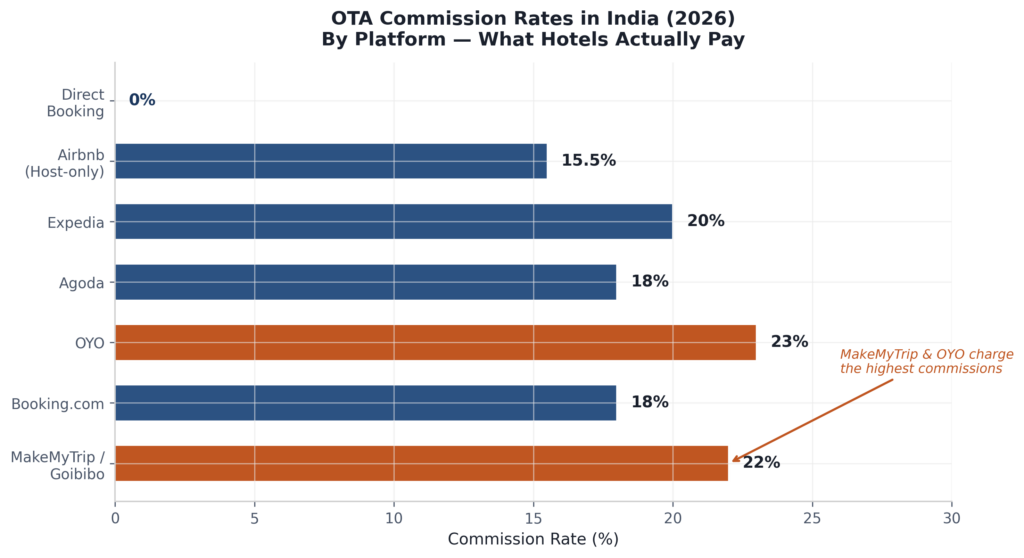
Figure 3: OTA Commission Rates in India by Platform (2026)
GST and Tax Compliance Gaps (14%)
This is a uniquely Indian leakage source that does not exist at this scale in other markets. The Indian GST regime for accommodation creates three distinct rate slabs: 0% for tariffs below Rs 1,000, 12% for Rs 1,001-7,500, and 18% for above Rs 7,500. This step-function pricing creates a powerful psychological and economic disincentive for hotels to price just above a threshold. A hotel pricing at Rs 7,600 faces 18% GST, making the effective guest cost Rs 8,968, while pricing at Rs 7,450 with 12% GST costs the guest only Rs 8,344, a Rs 624 difference. Independent hotels frequently fail to optimize around these breakpoints, either leaving money on the table by underpricing or losing competitiveness by overpricing.
Beyond the rate threshold challenge, GST compliance itself creates leakage. Properties without dedicated accountants struggle with varying GST slabs across rooms, food, and ancillary services. Delayed input-tax credit refunds constrain working capital, especially during off-peak months. Divergent state-level interpretations of GST applicability complicate OTA invoicing systems. The Mordor Intelligence analysis rates this complex multi-layer GST burden as a -1.2% drag on market CAGR, with impact highest on micro-entrepreneurs outside metro hubs. Hotels that invest in automated tax calculation within their PMS and train front-desk staff on GST-aware pricing recover significant leakage.
Unbilled Services and Ancillary Revenue (18%)
Ancillary revenue leakage is substantial in both markets, but for different reasons. In India, independent hotels recorded a 70.3% TrevPAR premium over rooms revenue in Q1 2026, the highest of any chain scale. This means F&B, spa, parking, and other services represent a critical profit center, yet many properties fail to capture these charges consistently. Room service orders that never make it onto guest folios, minibar usage tracked manually but not billed, spa treatments provided but not recorded, and parking fees forgotten during busy times are common leaks. The root cause is typically a disconnect between the service delivery point and the billing system.
In the Middle East, ancillary leakage manifests differently. Luxury and resort properties with extensive F&B outlets, spa facilities, and recreational amenities face complex multi-outlet operations where charges must flow from the POS to the guest folio. Properties with large event and function spaces frequently overlook revenue optimization for meeting rooms, which Duetto identified as a common gap. Limited visibility and lack of robust analytics around ancillary revenue streams make it difficult for revenue leaders to understand true commercial performance. The solution in both markets is the same: integrate POS systems with the PMS, implement closed-loop verification for all billable services, and train staff on the revenue impact of every unbilled charge.
B2B Rate Leakage and Wholesale (10%)
This is a particularly Middle East-centric leakage source, though it affects India as well. One of the most costly but often overlooked mistakes is uploading corporate or wholesale (B2B) rates into public OTA channels. The result is deeply discounted rates appearing on metasearch or OTA listings, often undercutting the hotel’s own direct price. This damages rate parity, cannibalizes B2C and direct bookings, and confuses potential guests who see different prices on different platforms.
The problem is exacerbated in the Middle East by the region’s heavy reliance on corporate and MICE business. Corporate contract rates negotiated for volume business should never appear on consumer-facing channels, yet without proper rate plan segregation and channel-level visibility controls, these rates leak into the public domain. Hotels should segregate B2B rates from public-facing rate plans, offer discounted rates only through proper B2B platforms such as vetted bedbanks and wholesalers, and use channel manager tools that assign and control rate visibility by channel. Dynamic static rates, which prevent ADR and RevPAR from being cannibalized, are increasingly essential in markets with complex distribution ecosystems like Dubai and Riyadh.
Pricing Inefficiencies, No-Shows, and Operational Waste (26%)
The remaining leakage sources, pricing inefficiencies (12%), no-show and cancellation gaps (8%), and operational waste and billing errors (6%), follow patterns similar to global markets but with regional nuances. In India, static pricing remains prevalent among independent hotels, with many properties setting a single rate for all seasons and segments. Hotels using real-time demand data and predictive analytics can boost RevPAR by 15-25%, yet adoption of dedicated RMS solutions remains low outside the premium segment. The 42% of small hotels that cite implementation complexity and system integration as key barriers to RMS adoption are effectively leaving this uplift on the table.
In the Middle East, the shrinking booking window makes pricing discipline even more critical. With 40-50% of bookings now made within 0-7 days, hotels must respond to demand signals in real time. Properties relying on weekly or monthly rate reviews miss compression opportunities that appear and disappear within days. No-show and cancellation leakage is amplified by OTA cancellation policies that differ from hotel terms, with Booking Holdings platforms showing cancellation rates of 37.2% in comparable markets. When cancellation fees are waived without documentation, or no-show charges are missed, the hotel absorbs 100% of the lost revenue. Operational waste, including F&B inventory shrinkage, energy inefficiency, and housekeeping supply loss, adds hidden costs that erode the already-thin GOP margins typical of independent hotels.
Detection and Prevention Playbook
The following playbook is organized around the Three Pillars framework, with specific actions tailored to the India and Middle East context. Each action is categorized by implementation timeline and expected impact.
Governance & Process Actions
- Assign Clear Revenue Ownership:Designate a single revenue owner (GM, owner, or dedicated revenue manager) with accountability for all leakage metrics. In family-owned Indian hotels and Middle East properties with multiple stakeholders, this clarity is often missing. Document the role, authority levels, and reporting structure.
- Document and Enforce SOPs:Create written SOPs for rate overrides, comp stays, cancellation fee waivers, F&B posting verification, and night audit reconciliation. Train all staff and test compliance monthly. Properties with documented SOPs recover 40-50% more leakage than those without.
- Implement Approval Thresholds:Every adjustment over a defined rupee or dirham threshold requires manager approval with reason documentation. Start with Rs 500 / AED 25 and tighten over time. Log all exceptions for monthly review.
- Standardize Night Audit Discipline:The night audit is the daily financial checkpoint. Standardize the process across all shifts with a checklist covering rooms revenue verification, F&B posting reconciliation, rate override review, no-show charge validation, and GST calculation accuracy.
Technology Stack Actions
- Audit System Integration:Map every system in your technology stack. Identify disconnects between PMS, POS, channel manager, and accounting. Prioritize fixing the highest-impact gaps first, typically PMS-to-POS for F&B billing and PMS-to-channel manager for rate parity.
- Migrate to Cloud PMS:If you are still on a legacy on-premise system, plan a migration to cloud PMS. The payback period is typically 12-18 months through reduced leakage alone. Indian hotels report 84% operational improvement after cloud adoption. Budget 4-8 weeks for basic migration.
- Implement GST-Aware Pricing Tools:For Indian properties, ensure your PMS calculates GST correctly at all rate thresholds and generates compliant invoices automatically. This eliminates manual calculation errors and ensures consistent tax treatment across all bookings.
- Deploy Rate Shopping and Parity Monitoring:Use automated tools to monitor your rates across all channels daily. Alert when OTAs undercut your direct price or when B2B rates appear on consumer channels. Free tools like Google Hotel Search provide basic monitoring; paid solutions offer automated alerts.
- Invest in Basic RMS Capability:Even entry-level demand-based pricing tools improve RevPAR by 10-15%. Start with weekend/weekday splits and event-based adjustments. As integration maturity improves, add competitive rate shopping and demand forecasting.
Clean Data & Insights Actions
- Define Core KPIs and Dashboards:Track net RevPAR (after commissions), net ADR by channel, guest billing accuracy rate, OTA commission as percentage of revenue, F&B cost percentage, and direct booking ratio. Review weekly, not monthly.
- Reconcile Cross-System Data Monthly:Compare PMS reservation data, channel manager bookings, POS revenue, and accounting entries. Identify and investigate every discrepancy. This cross-system reconciliation catches leakage that individual system reports miss.
- Move Up the Analytics Maturity Curve:If you are at descriptive analytics (reporting what happened), add diagnostic analysis (variance reports, exception tracking). Aim to reach predictive capability (demand forecasting, competitor monitoring) within 12 months. Prescriptive analytics requires dedicated RMS investment but delivers the highest returns.
- Build a Revenue Protection Culture:Share leakage metrics with department heads. Celebrate improvements. Make revenue protection a shared KPI, not just a finance or revenue management responsibility. Hotels that build this culture sustain their gains; those that treat leakage as a one-time project see leakage return within 6-12 months.
Revenue Recovery Roadmap
The financial impact of a structured revenue protection program can be transformational. Consider a 75-room independent hotel in Jaipur or Jeddah, operating at 65% occupancy with a $100 (Rs 8,500 / SAR 375) ADR. Annual room revenue is approximately $1.78 million. At a conservative 10% leakage rate, this property loses $178,000 per year to preventable gaps. Recovering even 60% of that leakage through the Three Pillars framework adds $107,000 to the bottom line.
The recovery should be phased over 12 months, with each phase building on the previous one. Phase 1 (Months 1-3) focuses on governance quick wins: assigning revenue ownership, documenting SOPs, enforcing approval thresholds, and implementing daily night audit discipline. These actions require minimal investment and typically recover 35-45% of total leakage. Phase 2 (Months 4-6) adds technology integration: cloud PMS migration, POS-to-PMS connection, channel manager cleanup, and rate parity monitoring. These investments typically recover another 25-30% of leakage. Phase 3 (Months 7-12) optimizes through data: RMS implementation, advanced analytics, dynamic pricing, and direct booking initiatives. This phase captures the remaining 15-25% of recoverable leakage and builds sustainable competitive advantage.
| Phase | Timeline | Key Actions | Est. Recovery |
| Phase 1: Governance | Months 1-3 | SOPs, ownership, night audit, approvals | $35-55K/yr |
| Phase 2: Technology | Months 4-6 | Cloud PMS, POS integration, parity monitoring | $25-40K/yr |
| Phase 3: Optimization | Months 7-12 | RMS, analytics, dynamic pricing, direct booking | $20-30K/yr |
| Total Annual Impact | 12 months | All Three Pillars operational | $80-125K/yr |
The critical success factor is treating revenue leakage prevention as a continuous operational discipline, not a one-time fix. Hotels that build the Three Pillars, governance, integrated technology, and clean data, into their daily operations and hold teams accountable for results achieve sustained protection. In markets as dynamic as India and the Middle East, where demand patterns shift rapidly, new supply constantly enters the market, and distribution channels evolve continuously, this discipline is not optional. It is the difference between thriving and merely surviving.